Grafana Dashboard
HAMi provides a Grafana dashboard for cluster GPU capacity, resource allocation, physical GPU usage, and per-container vGPU usage. NVIDIA hardware metrics can be added through DCGM Exporter.
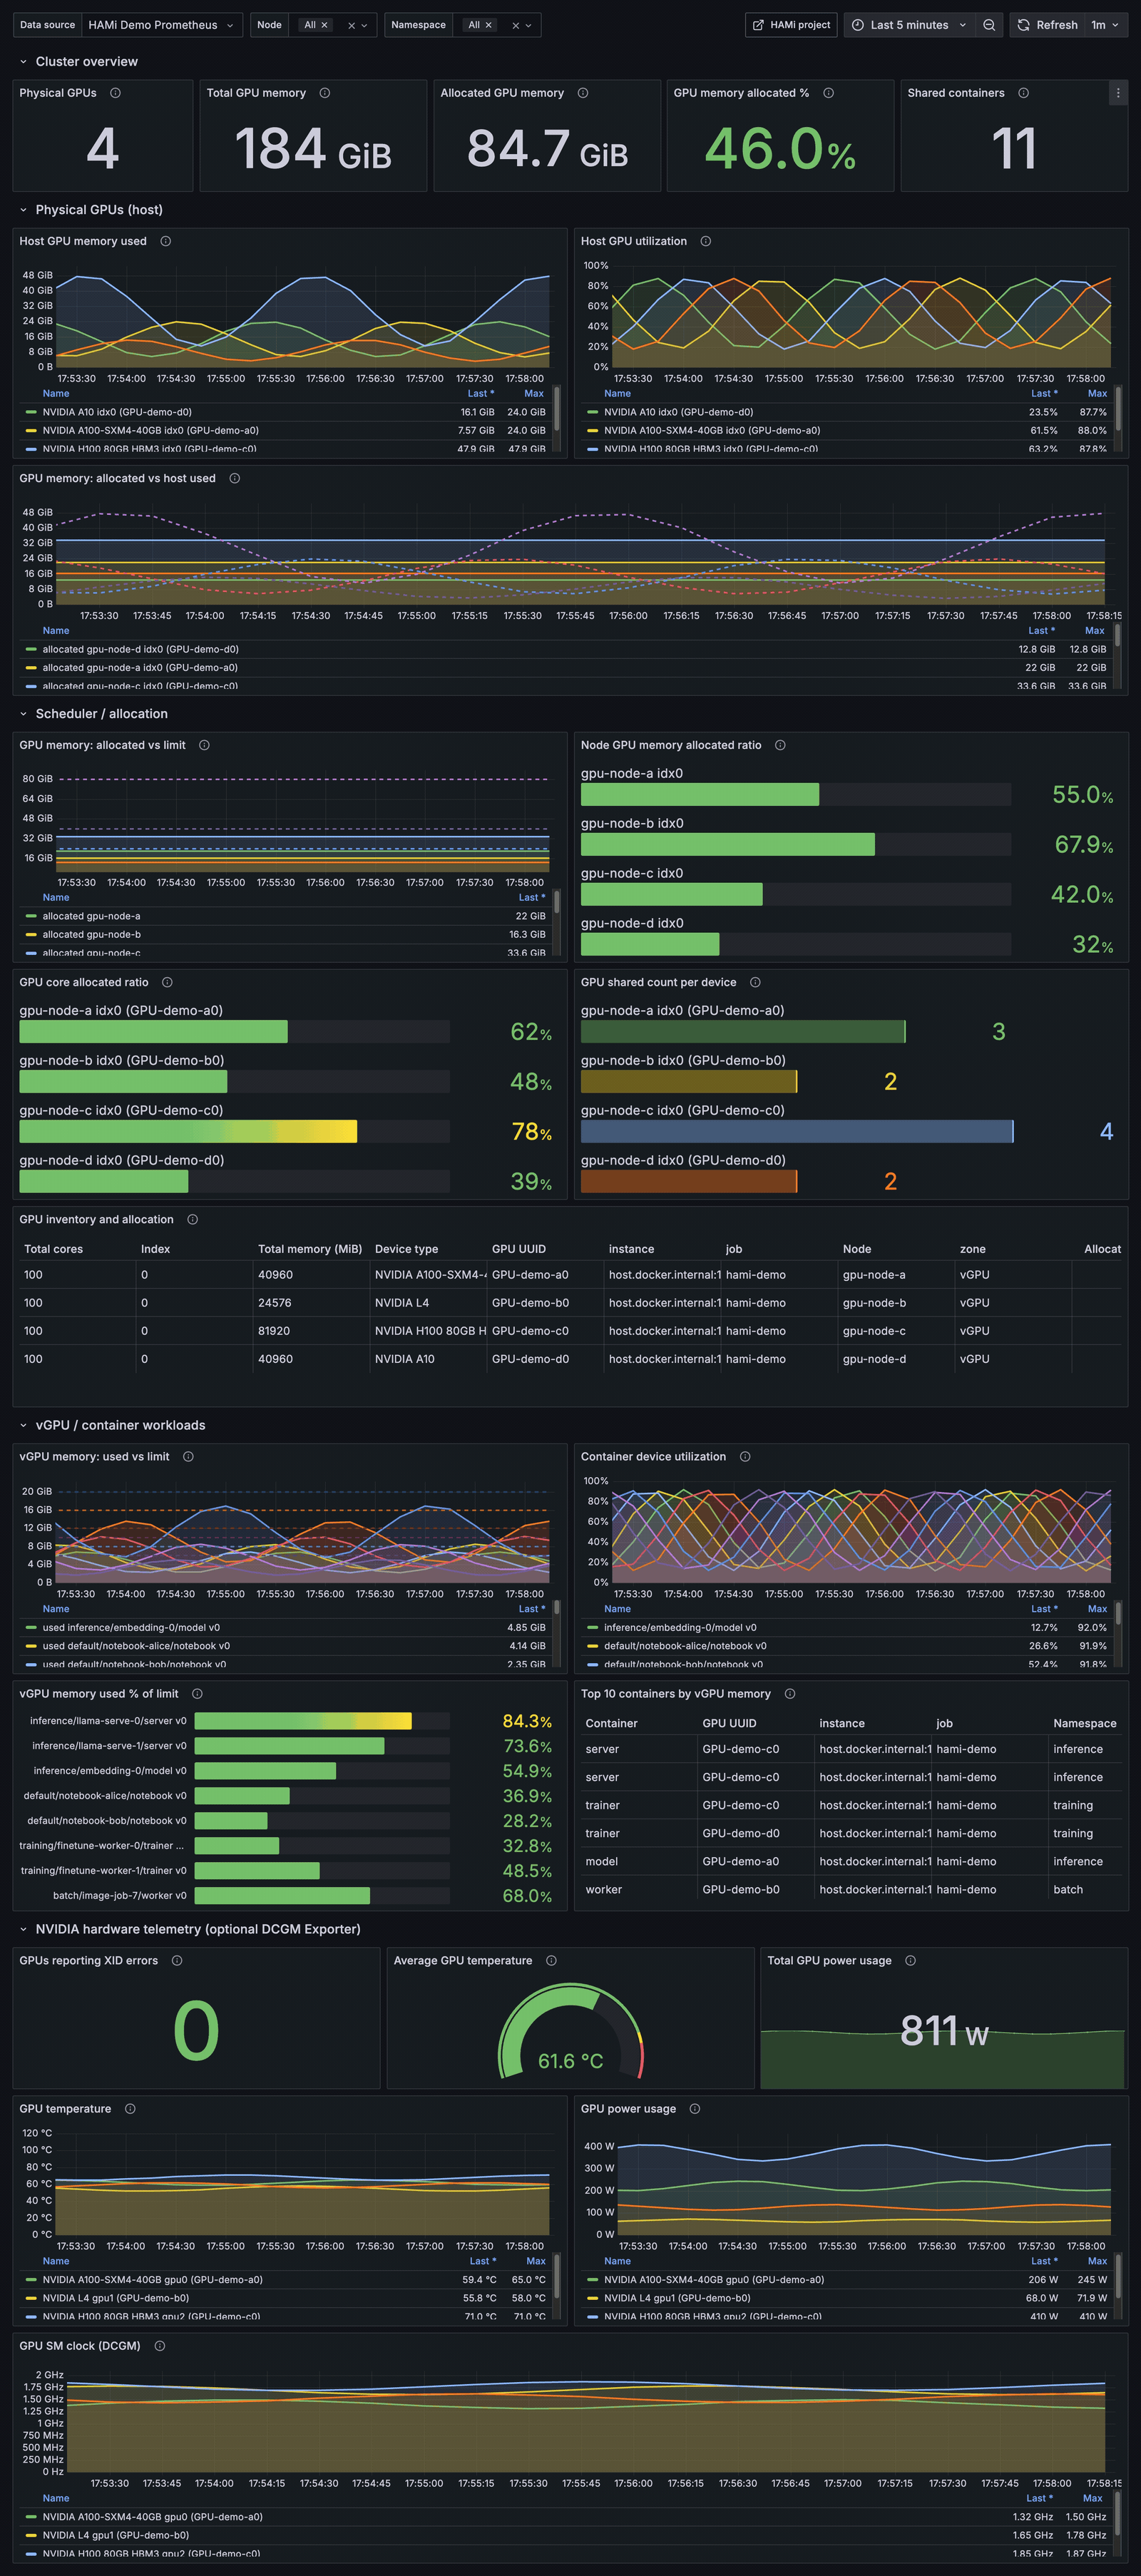
Open the full dashboard screenshot.
Compatibility
| Component | Requirement |
|---|---|
| HAMi | v2.10.0 or later |
| Grafana | 9.x or later |
| Prometheus | Scrapes both the scheduler and vGPU monitor metrics endpoints |
| DCGM | Optional; required only for the NVIDIA hardware telemetry row |
Configure Prometheus
The dashboard reads metrics from two HAMi components:
| Component | v2.10.0 default NodePort | Metrics |
|---|---|---|
hami-scheduler | 31993 | Capacity, allocation, sharing, and device inventory |
| vGPU monitor on nodes | 31992 | Physical GPU and per-container vGPU usage |
In HAMi v2.10.0, both monitor Services use NodePort by default. Check that the scheduler and vGPU monitor endpoints are reachable:
curl http://<kubernetes-node-ip>:31993/metrics
curl http://<kubernetes-node-ip>:31992/metrics
Prometheus Operator
If Prometheus Operator is installed, enable the ServiceMonitors included in the HAMi Helm chart:
helm upgrade --install hami hami-charts/hami \
  --namespace kube-system \
  --set prometheus.enabled=true
The chart creates separate ServiceMonitors for hami-scheduler and the vGPU monitor. The monitoring.coreos.com/v1/ServiceMonitor CRD must exist before Helm renders the chart. The vGPU monitor ServiceMonitor also requires devicePlugin.enabled.
Verify that the Prometheus serviceMonitorSelector and namespace selector match both resources. prometheus.enabled=true creates the ServiceMonitors; it does not install Prometheus or Prometheus Operator.
Prometheus without the Operator
Use Kubernetes service discovery to scrape all HAMi endpoints. The following example assumes that HAMi is installed in kube-system. Change the namespace when namespaceOverride is set.
scrape_configs:
  - job_name: hami
    kubernetes_sd_configs:
      - role: endpoints
        namespaces:
          names:
            - kube-system
    relabel_configs:
      - source_labels:
          - __meta_kubernetes_service_label_app_kubernetes_io_component
        regex: hami-(scheduler|device-plugin)
        action: keep
      - source_labels:
          - __meta_kubernetes_endpoint_port_name
        regex: monitor(port)?
        action: keep
Prometheus requires RBAC permissions to discover Services and Endpoints through the Kubernetes API.
Import the dashboard
- Download gpu-dashboard.json.
- In Grafana, open Dashboards > New > Import.
- Upload the JSON file.
- Select the Prometheus data source that contains HAMi metrics, then select Import.
To import the dashboard through the Grafana API:
curl -sS -X POST "${GRAFANA_URL}/api/dashboards/db" \
  -H "Authorization: Bearer ${GRAFANA_TOKEN}" \
  -H "Content-Type: application/json" \
  -d "{\"dashboard\": $(cat gpu-dashboard.json), \"overwrite\": true}"
The JSON uses a data source variable instead of a fixed Prometheus UID. Select the Prometheus data source after importing the dashboard.
Dashboard variables
| Variable | Description |
|---|---|
| Data source | Prometheus data source |
| Node | Filters physical GPU and scheduler panels; supports multiple values |
| Namespace | Filters vGPU workload panels; supports multiple values |
Dashboard rows
| Row | Panels |
|---|---|
| Cluster overview | Physical GPU count, total memory, allocated memory, and shared containers |
| Physical GPUs (host) | Real-time memory usage and utilization, with allocation comparisons |
| Scheduler / allocation | Device limits, allocation ratios, sharing, and GPU inventory |
| vGPU / container workloads | Per-container vGPU memory, limits, and utilization |
| NVIDIA hardware telemetry (optional DCGM Exporter) | XID errors, temperature, power usage, and SM clock |
DCGM Exporter (optional)
The NVIDIA hardware telemetry row requires these DCGM Exporter metrics:
DCGM_FI_DEV_XID_ERRORSDCGM_FI_DEV_GPU_TEMPDCGM_FI_DEV_POWER_USAGEDCGM_FI_DEV_SM_CLOCK
The queries match the DCGM UUID label to HAMi's device_uuid label.
Troubleshooting
| Symptom | Check |
|---|---|
| Cluster overview or inventory is empty | Prometheus target for hami-scheduler on port 31993 |
| Physical GPU panels are empty | Every vGPU monitor Service endpoint is discovered |
| Container panels are empty | A vGPU workload is running and the correct namespace is selected |
| Node or Namespace has no values | The selected Prometheus data source contains the corresponding labels |
| Hardware telemetry is empty | DCGM Exporter is scraped and its metrics contain the UUID label |
For metric definitions, see Cluster device allocation and Real-time device usage.
